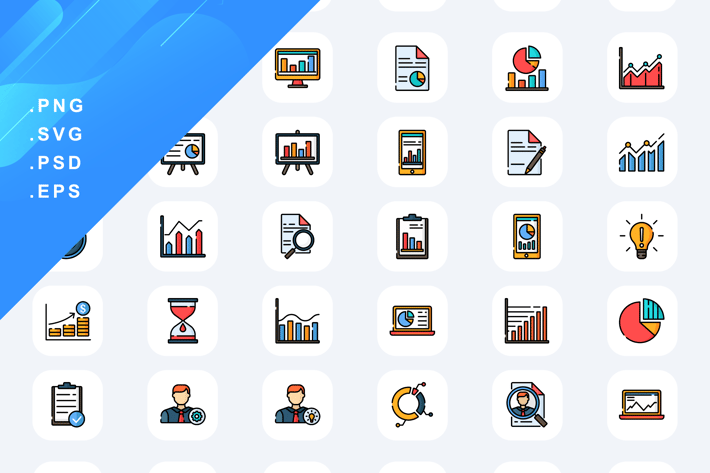
Business Analytics Icons
Author
Wencory
Published
Jun 25, 2022
Item Code
83cd57c0-56b0-4a2f-bbae-30214b82b8a4
How to Download
- 1 Copy the Item Code above
- 2 Go to fuckdcma.com
- 3 Paste the code in the text box and click "Generate Download Link"
About This Item
Optimize data presentation & streamline corporate analysis designs with the Business Analytics & Financial Reporting Icons (Color Filled) collection. This library features icons in a modern outline style with vibrant color fills, tailored for financial software, marketing dashboards, and statistical presentations.
The collection provides comprehensive coverage of data visualization, including detailed icons for pie charts, bar graphs, rising line trends, and growth statistics. It addresses digital reporting with visuals for computer monitors displaying analytics, mobile dashboards, and presentation boards. Crucially, the library includes analysis & documentation assets such as magnifying glasses on reports, clipboards, verified documents, and analyst avatars. The iconography also covers productivity tools like hourglasses and lightbulbs, making it a complete solution for business intelligence projects.
Ideal Use Cases:
Dashboard & UI Design: Essential assets for designs involving "Analytics Widgets," "Sales Trackers," "Admin Panels," & "KPI Visuals."
Corporate Reporting: Functional visuals for "Annual Financial Reports," "Market Research," "Audit Summaries," & "Budget Presentations."
* Marketing & Strategy: Clear icons for "Growth Metrics," "Conversion Rates," "SEO Analysis," & "Project Status Updates."
More from Wencory
View all →

You May Also Like

50 Birthday Flat Greyscale Icons
by IconBunny
Set of 12 Watercolor Backgrounds
by AnnaIvanir
60 Avatars Line Inverted Icons
by IconBunny
Simple Set Power Industry and Energy Flat Icons
by alexdndz
Flower cliparts
by dandelionery
Electronics 25
by lastspark
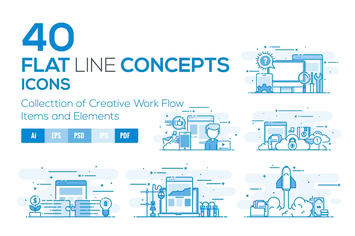
Flat Line Designed Concepts
by graphics4u
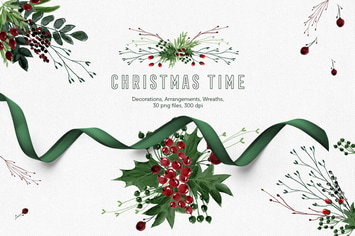
Christmas Time Collection
by Webvilla